3. How to run Quantifier
|
Create three new folders: for example, “Segmentations”, “Atlas_maps” and “Output”. Transfer the segmentations to the “Segmentations” folder, the atlas maps to the “Atlas_maps” folder. Leave the “Output” folder empty.
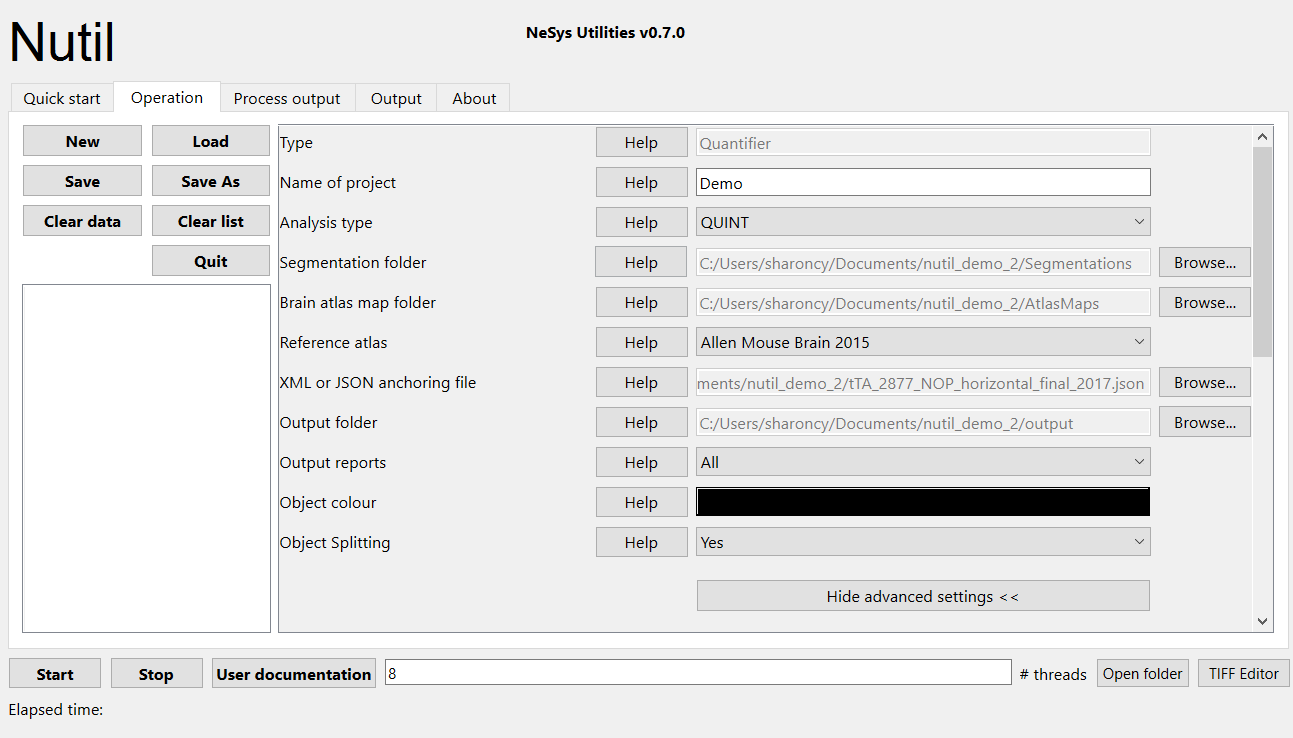
To begin, click “New”. Enter a name for your project.
Press the “browse” buttons and navigate to the folders containing the segmentations, the atlas maps and the output folder, and to the JSON file containing the registration information.
Select the reference atlas to use for the analysis. This is the reference atlas that was used in QuickNII and VisuAlign for registering your sections e.g. Allen Mouse Brain Atlas CCFv3, 2017.
Tip
Nutil also supports use of a custom reference atlas as long as the atlas is available in QuickNII and VisuAlign (contact user support to request integration of your atlas in these tools). See below for how to use a custom atlas in Nutil.
Fill in the rest of the form. The software includes “Help” buttons with more information for each parameter.
“Advanced settings” reveals more settings: this gives flexibility for customised analysis. For example, apply a minimum object size cut-off, generate reports for your own custom regions (compilations of reference atlas IDs) and to apply masks. If nothing is changed in the advanced settings, the default settings shown below are used.
Press “Save as”. This saves a copy of the settings in a simple text file in .NUT format. This is useful for future reference, and may be reloaded into Nutil via the “load” button (for example, to repeat the analysis on a new set of images).
Nutil automatically detects the number of core processors (threads) available on the computer (8 in the example). To ensure adequate processing power, choose at least one less than the total available (6 or 7 here) and press “Start”. Wait until the process is complete: this may take minutes or hours depending on the number of sections and size of the segmentations. If your images are very large and Nutil crashes, select fewer cores.
The output files are automatically saved in the specified output folder.
Advanced Parameter |
Default settings |
|---|---|
Minimum object size |
1 pixel |
Pixel scale |
1 pixel |
Use custom masks |
No |
Output report type |
CSV |
Apply customised regions |
Default |
Coordinate extraction |
All (Yes, for whole series and per section) |
Pixel density |
1 coordinate per pixel |
Unique ID format |
_sXXX… |
Tip
See the FAQ for more information on the Pixel Scale.
3.1. How to use a custom atlas in Nutil
Nutil has several atlases built into the software (e.g. Allen Mouse Brain Atlas and the Waxholm atlas of the Sprague Dawley rat). For reference atlases that are available in the QuickNII and VisuAlign software but are not integrated in the Nutil software, it is possible to use these atlases in Nutil using the custom atlas feature. To do this:
Select “Custom” for Reference Atlas in Nutil Quantifier. This reveals a new field - Custom reference atlas.
For Custom reference atlas, navigate to the .LABEL file for your custom atlas. This is the same .LABEL file used in QuickNII and VisuAlign to define the region IDs and region names.
Run the analysis as normal.
3.2. Python plots
Tip
Nutil v0.8.0 has an automatic plotting feature. The Python scripts are included as part of the Nutil package.
THe plotting feature will work if Python is installed on the computer, with the Python.exe selected in Nutil through: File –> Settings. It is also necessary to install the following Python packages on your computer: numpy, pandas and matplotlib.
For how to install Python and packages refer to Python documentation.