7. How to interpret the results
Nutil generates up to three sets of reports, overlay images and a .NUT file. The sections below give more information on each type of file.
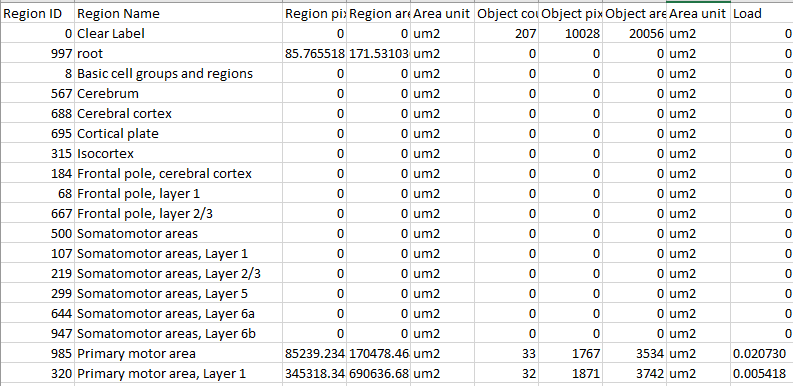
For each report, interpret the results as follows:
Region pixels |
Number of pixels representing the region. |
Region area |
Area representing the region (region pixels x pixel scale). |
Area unit |
Region area unit (unit of the pixel scale). |
Object count |
Number of objects located in the region (N/A if object splitting “ON”). |
Object pixels |
Number of pixels representing objects in this region. |
Object area |
Area representing objects in this region (object pixels x pixel scale). |
Load |
Ratio of Object pixels to Region pixels (Object pixels / Region pixels). |
The main results are:
Load. This refers to the regional load or area fraction. Use this with object splitting switched ON (object splitting OFF may invalidate the % load).
Count. This is a count of segmented objects that fall within the region. Use this for small objects only with the object splitting switched OFF (object splitting ON may invalidate the counts).
See Object splitting explained.
7.1. RefAtlasRegion reports
CSV files listing quantifications per atlas-region for each region assigned voxels in the reference atlas volume. There is a report per section and a report for all sections combined (whole series).
Example
Tip
Understanding reference atlas regions
Reference atlas regions are organised in systematic hierarchies that group related regions. For example, the whole brain “root” structure is subdivided into “parent” structures (e.g. cortical plate), which are subdivided into “child” structures (e.g. isocortex, olfactory areas, hippocampal formation), which are further subdivided into detailed “child” structures (e.g. hippocampal cell layers), etc. There can be many levels of granularity, with the regions at the finest levels of granularity predominately assigned to voxels in the atlas volume.
While the reports list all the regions in the reference atlas hierarchy, Nutil only gives results for regions assigned to voxels in the atlas volume. This means that many regions give no results. These regions are either “parent” structures which have been delineated into smaller regions and so are no longer assigned voxels in the volume, or “child” structures that have not been delineated yet (may come in future atlas releases). Regions with no results should be excluded from analysis.
For some regions, results may be given at coarser levels as well as for finer levels of the atlas hierarchy (e.g. thalamus and for thalamic subregions). This happens if a “parent” region has been subdivided into subregions, but some voxels are unassigned, instead remaining with the “parent” structure. Results reported for these “parent” regions (e.g. thalamus) correspond to “parent region, unassigned voxels”, not to the whole parent structure. As most “parent regions, unassigned” correspond to small volumes (sometimes only a few voxels), results from these regions should be removed from your analysis or reported as “parent region, unassigned”.
To get usable results for a “parent” structure (e.g. thalamus), use the custom region feature in Nutil. This allows you to combine reference atlas regions into your own customised regions.
Note
The Clear Label ID covers objects that fall outside of the atlas volume.
7.2. CustomRegion report
CustomRegion reports contain quantifications for broader regions. These broader regions are compilations of reference atlas regions, and may either be user-defined (“custom”) or the default regions included in the Nutil software (“default”). For more information see the “Customised regions explained” section. A report is provided for the whole series (all sections combined) and per section.
7.3. Object report
Object reports contain information about individual objects: it lists all the objects in the whole series and per section. As object splitting invalidates the object counts, this report is only generated when the object splitting feature is switched “OFF”.
By switching “ON” the “display object IDs in image file and reports”, a unique ID is assigned to each object in your dataset. These IDs are displayed in the image files and in the object reports to enable identification.
7.4. Overlay images
Segmentations superimposed on the atlas maps in PNG format.
The object colours are assigned based on the customised regions. If no regions are specified, or object falls outside of the specified areas, the objects are displayed in red by default.
The object ID assigned to an object (for the purpose of identification in the Object report), as well as the reference atlas region ID corresponding to its location, may be printed on the overlay images by switching “ON” these options in the “Advanced Settings” for Nutil Quantifier. If both these are switched “ON”, the reference atlas region ID is printed at the top and the object ID at the bottom.
7.5. Coordinates
JSON files containing point clouds with the coordinates following a Right-Anterior-Superior (RAS) orientation and expressed in voxels. These can be directly viewed with the MeshView Atlas Viewer.
For more information on the coordinate system and how to convert to Allen CCFv3 and Waxholm Space coordinates, see here.
Links to Meshview are available here
Online converters are provided here.
Warning
The coordinates generated with Nutil version 0.8 reflect both the linear and nonlinear transformation applied with QuickNII and VisuAlign. Nutil version 0.4 - 0.7 are based on the linear transformation only and do not take into account the nonlinear transformation.
7.6. NUT file
The NUT file is a text file that contains the parameters that were used for the Nutil analysis. This can be loaded into Nutil Quantifier with the “load” button to recreate the analysis.
To view its content, open the NUT file in Notepad. As the NUT file is an internal document intended for the transfer of metadata only, it is not always easy to interpret. Some of the parameters stored in the file are conditional on other fields, and so are not activate unless the condition is met. For example, the custom_mask_colour field is not applied unless use_custom_masks = Yes. However, the NUT file does contain information about the Nutil version used for the analysis, and can give clues to potential errors and is useful for problem solving.