6. Custom regions explained
Quantifier generates several reports including “Custom Region” reports. These contain quantifications for broader regions. The regions are compilations of reference atlas regions and may either be user-defined (“Custom”) or the default regions included in the Nutil software (“Default”). These regions (“Custom” or “Default”) are also assigned to the coordinates extracted by Nutil (coordinate output).
Tip
The QCAlign software has a viewer for exploring the reference atlas hierarchy. It can be used to create a custom region file compatible with Nutil (hierarchy sheet, txt format).
6.1. Custom Region reports
The simplest option is to run the analysis with the “default” regions built into the Nutil software. Select “default”.
More information on the default regions are found in the CustomRegion files provided in the Nutil software package, located in the CustomRegion folder. The “default” option is a complete brain analysis, which means it includes all the reference atlas regions compiled into broader regions. For the Allen Mouse Brain Atlas CCFv3 (2017) the custom regions are: cortex; fiber tracts; hippocampus; olfactory regions; hypothalamus; regions in the striatum and pallidum; midbrain - hindbrain - and medulla; thalamus; cerebellum; and ventricular system.
Alternatively, generate CustomRegion reports based on your own region definitions (define maximum 128 regions). First create a file defining your regions (cvs or xlsx format), select “custom” and then navigate to the relevant file.
There are two options for generating this file:
Use the QCAlign software (hierarchy sheet in CSV format).
Define your own regions using the CustomRegionsTemplate.xlsx provided in the CustomRegion folder of the Nutil package. Fill in the template exactly as shown below:
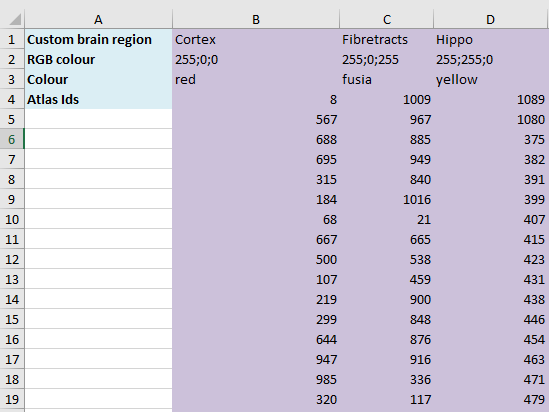
ROW 1: assign your own names to the regions (For example, cortex).
ROW 2: assign colours to the regions. Do this by typing a RGB colour code in the following format: 255;0;0 (for red). This colour will be assigned to the objects located in the custom region for the purposes of the image output and coordinate output (for display purposes only).
ROW 3: enter the colour name (this is for information purposes only).
ROW 4: define the region by listing the reference atlas IDs to include. The excel sheets in the AtlasHierarchy folder list all the regions and IDs for each atlas.
For mouse, see the ABAHier2015.xlsx or ABAHier2017.xlsx file for the full list of regions and IDs.
For rat, see the WHS_rat_atlas_v2.xlsx or WHS_rat_atlas_v3.xlsx file for the full list of regions and IDs.
The default .xlsx may be used as a guide for filling out the template.
6.2. Coordinate output
The coordinates extracted by Nutil are assigned region names corresponding to the custom regions defined in Nutil. To assign your own regions (and not the “default” regions), use the “custom” region feature described above.
Warning
It is possible to define a maximum of 128 custom regions (if the Excel sheet contains more than 128 custom regions, only the first 128 will be used). Note that QCAlign may generate custom region files with more than 128 regions.